Regression Analysis: Matching the Method to the Data
What is Regression Analysis?
Regression analysis is one of the cornerstones of statistical methods used in data analysis and predictive modeling. It is a powerful statistical technique designed to examine the relationship between variables, making it an essential tool in fields such as economics, biology, social sciences, and more.
The core objective of regression analysis is to determine how changes in the independent variables influence the dependent variable – helping to better understand the underlying mechanisms driving the data to make better predictions and decisions.
What are the Different Types of Regression Analysis?
The versatility of regression models allows them to be applied to a wide range of data types and research scenarios. However, different types of regression models are specifically suited to handle distinct types of data and relationships, making it essential to choose the right one depending on the nature of the data and the research objectives.
Whether the data is continuous, categorical, binary, or count-based, each type of regression method is designed to accommodate the research goals and unique qualities of the dataset. For example, while linear regression is ideal for modeling straightforward relationships in continuous variables, logistic regression is better suited for binary or categorical outcomes. Similarly, when working with complex, high-dimensional data, more advanced techniques like Partial Least Squares (PLS) regression, Ridge, and Lasso regression may be required.
Which Regression Model is Right for Your Data Analysis?
Choosing the wrong regression model can lead to inaccurate conclusions and poor predictive performance. To determine the right model for your data, you need to understand the strengths, weaknesses, and appropriate applications of each regression model type.
In this regression analysis guide, we’ll discuss several common types of regression, highlight the types of data they are best suited for, and illustrate their practical applications across various industries.
Download your free trial of XLSTAT to start applying these regression models to your data.
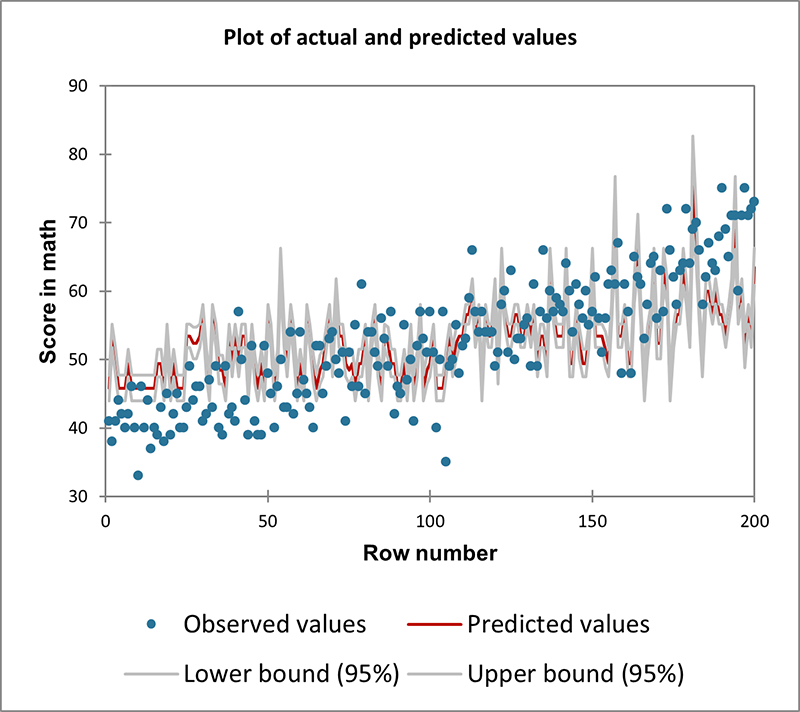
1. Linear Regression
- Data Type: Continuous dependent variable with one or more continuous independent variables.
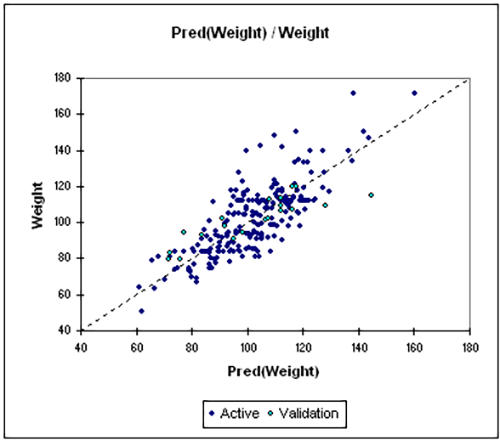
- Description: Linear regression (including both simple linear regression and multiple linear regression) examines the relationship between a dependent variable and one or more independent variables. It assumes a linear relationship and is used when both the outcome and predictors are continuous. The goal is to predict or explain the dependent variable using the predictors. This model helps in analyzing the combined effect of multiple factors on the outcome.
- Example: Estimating the influence of income and age on spending habits.
Learn more about linear regression analysis >>
2. Logistic Regression
- Data Type: Binary or categorical dependent variable (0 or 1). Multinomial logistic regression is also possible if the dependent variable has more than 2 categories. Continuous or categorical independent variables.
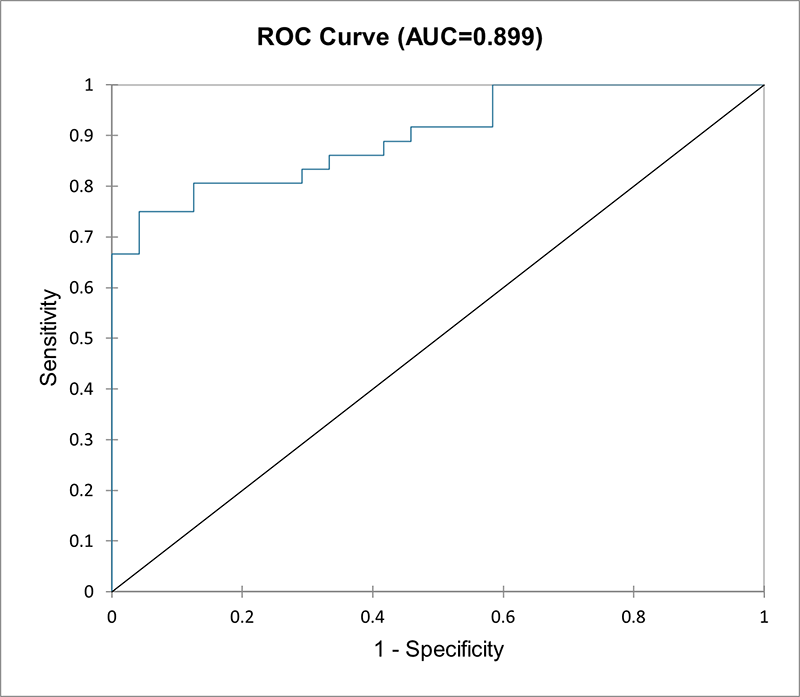
- Description: Logistic regression is used when the dependent variable is categorical (e.g., success/failure, yes/no, small/medium/tall). The output is modeled using a logistic function which predicts probabilities of different outcomes.
- Example: Predicting whether a customer will buy a product (yes/no) based on income, age, and previous purchase behavior.
Learn more about logistic regression >>
3. Partial Least Squares (PLS) Regression
- Data Type: Multivariate data with high-dimensional predictors (collinear and noisy). Continuous or categorical independent variables.
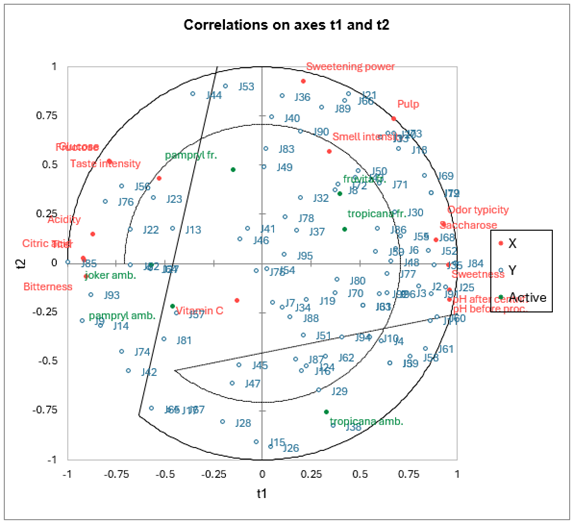
- Description: PLS regression is particularly useful when the predictor variables are highly collinear (i.e., they are strongly correlated with each other) or when the number of predictors exceeds the number of observations. PLS combines features from principal component analysis (PCA) and multiple regression by projecting the predictors into a new space and finding a linear relationship between these projections and the dependent variable.
- Application: PLS is widely used in chemometrics, bioinformatics, and other fields dealing with high-dimensional datasets.
- Example: Predicting chemical properties of a compound based on a large set of spectroscopic measurements.
Learn more about Partial Least Squares regression >>
4. Ridge, Lasso and Elastic Net Regression
- Data Type: Continuous dependent variable with many predictor variables (possibly correlated). Continuous or categorical independent variables.
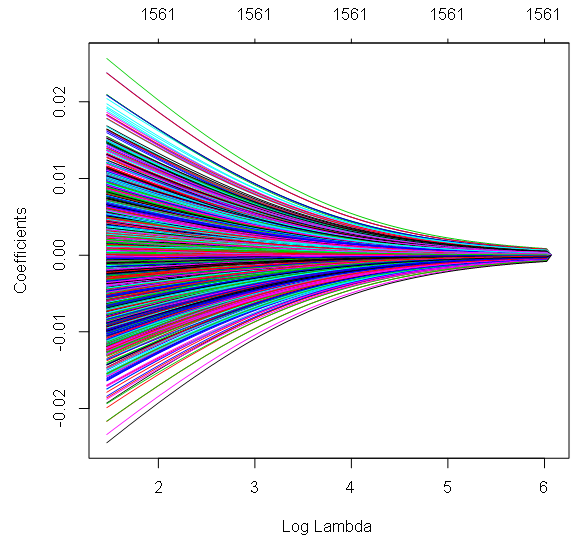
- Description: These are regularization techniques that modify the loss function to prevent overfitting, especially when dealing with multicollinearity. Ridge regression penalizes the sum of squared coefficients, while Lasso regression penalizes the absolute value of coefficients, often driving some coefficients to zero. Elastic Net is a mixture of these two methods.
- Example: Ridge regression is often used in genomics to predict disease risk based on thousands of genetic markers.
Learn more about Ridge regression >>
Learn more about Lasso regression >>
5. Log-linear (or Poisson) Regression
- Data Type: Count data (number of occurrences of an event). Continuous or categorical independent variables.
- Description: Poisson regression is ideal for modeling count data and rates, especially when the outcome represents the number of times an event occurs in a fixed interval (e.g., time, distance).
- Example: Modeling the number of calls received at a call center based on the time of day and number of operators on duty.
Learn more about Log-linear regression >>
6. Quantile Regression
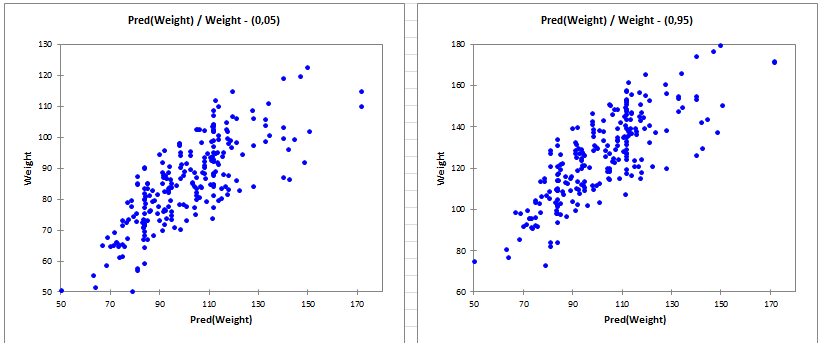
- Data Type: Continuous dependent variable with heterogeneous relationships across quantiles.
- Description: Unlike linear regression which estimates the mean of the dependent variable conditional on the predictors, quantile regression estimates the conditional median or other quantiles of the dependent variable. This makes it useful when the relationship between the variables varies across different points of the distribution, rather than being constant across the entire dataset.
- Application: Quantile regression is particularly effective when data exhibit non-constant variance or when outliers influence specific parts of the distribution.
- Example: Studying the impact of education on different quantiles of income distribution where factors might influence the lower, middle, and upper segments differently.
Learn more about Quantile regression >>
7. Nonparametric Regression (Kernel and Lowess)
- Data Type: Complex data without a predefined functional relationship between variables.
- Description: Nonparametric regression does not assume a specific functional form for the relationship between independent and dependent variables. Instead, it allows the data to determine the shape of the relationship polynomial regression are commonly used in nonparametric methods.
- Application: These methods are useful when there is little prior knowledge about the functional form of the relationship between variables or when the data are highly flexible or complex.
- Example: Modeling the relationship between temperature and plant growth where the relationship may vary non-linearly across different ranges of temperature.
Learn more about Nonparametric regression >>
8. Nonlinear Regression
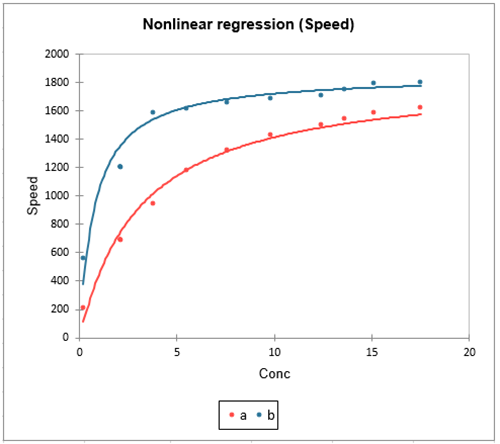
- Data Type: Continuous dependent variable with a non-linear relationship between variables.
- Description: Nonlinear regression is used when the relationship between dependent and independent variables cannot be adequately captured by a linear equation. The model can take various forms such as exponential, logarithmic, or polynomial relationships. Nonlinear regression requires iterative methods for parameter estimation since the parameters often cannot be solved explicitly.
- Application: It is often applied in fields like biology, economics, and engineering where relationships are inherently non-linear.
- Example: Modeling population growth over time using a logistic growth curve, where growth accelerates initially but slows as the population reaches the carrying capacity of the environment.
Learn more about Nonlinear regression >>
Start Making Regression Analysis Work for You
Choosing the best regression analysis doesn’t have to be daunting. With the right tools, you can easily explore and apply these methods to your data without needing an extensive statistical background. To help you get started, we offer a free 14-day trial of XLSTAT – powerful yet user-friendly statistical software that can help you unlock deeper insights and improve the reliability of your research and business decisions.
Latest tweets
No tweet to display