Analysis of a Taguchi design
Use this tool to analyze a Taguchi experimental design. Available in Excel with the XLSTAT software.

The Taguchi method is a method introduced by Genichi Taguchi (Genichi and Wu, 1980) which is a method of experimental design providing an improvement to full and fractional factorial designs.
It consists in using orthogonal tables, which have been pre-established by G. Taguchi, which depend on the number of runs to be performed, the number of factors in the model, and the number of levels by factors.
In conventional experimental designs, the goal is to identify the factors that affect the average response and control them at the desired levels. Taguchi's experimental designs deal with the mean and variability of measured characteristic values through the use of signal to noise ratios.
Options for the Analysis of a Taguchi design feature in XLSTAT
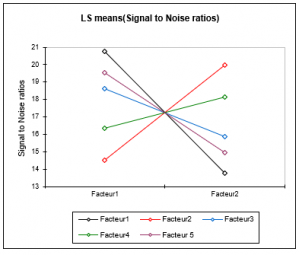
In order to find products that are robust and insensitive to variability, XLSTAT offers to study three parameters: the signal to noise ratios, the means and the standard deviations.
Signal to Noise ratios
Depending on the purpose of your experiment, several signal to noise ratios are available in XLSTAT:
- Larger is better
- Nominal is best: Type II
- Nominal is best: Type I
- Smaller is better
XLSTAT also allows you to adjust the linear model for these three parameters. A table of estimated regression coefficients will then be displayed, and it will be possible to determine which factors have statistically significant values
Output for the Analysis of a Taguchi design feature in XLSTAT
- Signal to Noise ratio
- Response table for means
- Response table for standard deviations.
- Goodness of fit statistics
- Analysis of variance table
- Parameters of the model
- Equation of the model


analyze your data with xlstat
Included in