Analytic Hierarchy Process (AHP)
Use this feature to solve multi-criteria decision problems based on a criteria hierarchization. Available in Excel with the XLSTAT software.

What is Analytic Hierarchy Process (AHP)?
Analytic Hierarchy Process is a method adapted to multi-criteria decision problems that have several solutions satisfying a set of criteria. The approach of the method is to simplify the problem by breaking it down into a hierarchical system. Thomas Saaty is at the origin of this method and created it in the 1970s.
We denote by alternative the solutions of the decision problem, criteria the parameters on which the alternatives are evaluated, subcriteria the parameters belonging to a criterion and on which alternatives are evaluated and evaluator the person who makes the evaluations. We talk about a 2-level problem when it admits subcriteria, otherwise, it is a problem of level 1.
The principle of the method is to evaluate 2 by 2 the elements of the problem in comparison tables. There are tables to define at each level of the hierarchy. At level 0 the criteria comparison table must be defined, at level 1 those of subcriteria if it is a level 2 problem, otherwise the comparison tables of alternatives over criteria. At level 2 the comparison tables of alternatives over criteria and/or subcriteria must be defined. The set of these tables is called the experimental design for an AHP analysis.
XLSTAT proposes the DHP tool to create your own design of experiments. It is available in the Decision Aid menu under the Advanced features ribbon.
How AHP works in XLSTAT
The comparison tables must be completed by the user according to the values chosen in the table of Saaty (see Help documentation). Saaty has defined an evaluation scale that measures the importance or the difference of one element over another one.
The first computation of the AHP method is the calculation of the criteria priority vector from the values of the criteria comparison table, i.e. the computation of the weight of each criterion. The equation is given by:
the weight of each criterion = sum of normalized lines/criteria number
With the same equation, the priority vector of subcriteria is calculated for each criterion. This vector is then weighted by the weight of the criterion linked. We thus obtain the weights of each criterion and subcriterion which are finally used as the weighting in the calculation of alternatives priority vectors with the same mathematical equation given above.
An option in the output results is proposed to assess the data consistency. This test controls the entered values in the comparison tables. Indeed, if the alternative A1 is evaluated slightly more important (code 2) than the alternative A2, and A2 is judged moderate important (code 3) than the alternative A3 and A3 strong important (code 5) than A1, then the test says that there is a data inconsistency. It is measured with 2 parameters: the coherence index (CI) and the coherence ratio (CR). The equation for the coherence index is as follows.
CI = mean coherence – element number / (element number -1)
The number of items is the number of columns or rows in the comparison table. To obtain the average consistency, we first multiply the comparison matrix with its priority vector, which gives us a new vector. Then, we divide the latter by the weight of the priority vector of the element of the same line. The average of this normed vector gives the average coherence. The formula for calculating the consistency ratio is given by:
CR = coherence index / random coherence
If the coherence ratio is less than or equal to 10$%$ then the assessment is considered consistent. On the other hand, if it is larger than 10$%$, it is recommended to review the evaluation of the concerned comparison table.
AHP output in XLSTAT
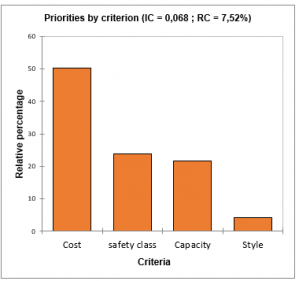
Mean priorities by criterion: this result, given as a table, corresponds to mean relative percentages of weight vectors by criterion over all evaluators. If the options “Bar charts” and “criteria” are selected the result is displayed as charts under the table.
Mean priorities by subcriterion: this result, given as a table, corresponds to mean relative percentages of weight vectors by subcriterion over all evaluators. If the options “Bar charts” and “subcriteria” are selected the result is displayed as charts under the table.
Mean priorities by alternatives: this result, given as a table, corresponds to mean relative percentages of weight vectors by alternatives over all evaluators. If the options “Bar charts” and “alternatives” are selected the result is displayed as charts under the table.
Results obtained from the ratings of evaluator x: give the set of tables and bar charts obtained for evaluator x according to selected options:
- Priorities by criterion: are the relative percentages for each criterion.
- Priorities by subcriterion of criterion X: are the relative percentages for each subcriterion of the criterion X.
- Priorities by alternatives: are the relative percentages for each alternative.
If the option « data consistency » is activated the parameters CI and CR are computed and displayed under tables (see the section description for more details).


analyze your data with xlstat
Included in