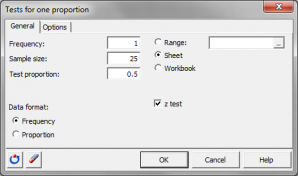
Test for one proportion
Tests for one proportion let you compare an observed proportion to a theoretical one. Available in Excel with the XLSTAT add-on statistical software.

Test for the comparison of one proportion
XLSTAT uses the z-test to to compare one empirical proportion to a theoretical proportion.
Let n be the number of observations verifying a certain property among a sample of size N. The proportion of the sample verifying the property is defined by p = n / N. Let p0 be a known proportion with which we wish to compare p. Let D be the assumed difference (exact, minimum or maximum) between the two proportions p and p0. D is usually 0.
The two-tailed (or two-sided) test corresponds to testing the difference between p – p0 and D, using the null (H0) and alternative (Ha) hypotheses shown below:
- H0 : p - p0 = D
- Ha : p - p0 ≠ D
In the one-tailed case, you need to distinguish the left-tailed (or lower-tailed or lower one-sided) test and the right-tailed (or right-sided or upper one-sided) test. In the left-tailed test, the following hypotheses are used:
- H0 : p - p0 = D
- Ha : p - p0 < D
In the right-tailed test the following hypotheses are used:
- H0 : p - p0 = D
- Ha : p - p0 > D
Assumptions for the z-test
This z-test is based on the following assumptions:
- The observations are mutually independent,
- The probability p of having the property in question is identical for all observations,
- The number of observations is large enough, and the proportions are neither too close to 0 nor to 1.
z statistic
One can find several ways to compute the z statistic in the statistical literature. The most used version is:
z = p – p0 - D ⁄ σ
The large sample approximation leads to the following estimate for its standard deviation: σ, σ
σ(π) = √ p (1– p) ⁄ N
The z statistic is asymptotically normally distributed. The larger N, the better the approximation. The p-value is computed using the normal approximation.
Confidence intervals for the comparison of one proportion
Many methods exist to compute confidence intervals on a proportion. XLSTAT offers the choice between four different versions: Wald, Wilson score, Clopper-Pearson, Agresti Coull.


analyze your data with xlstat
Related features