Complete disjunctive tables (Creating dummy variables)
Disjunctive tables are tables where columns are categories from one or several qualitative variables. Available in Excel with the XLSTAT statistical software.

What is a complete disjunctive table
A disjunctive table is a drill-down of a table defined by n observations and q qualitative variables V(1), V(2), ... V(q) into a table defined by n observations and p indicators (or dummy variables) where p is the sum of the numbers of categories of the q variables: each variable V(j) is broken down into a sub-table with q(j) columns where column k contains 1's for observations corresponding to the kth category and 0 for the other observations.
How to create a complete disjunctive table with XLSTAT
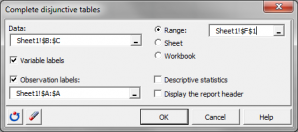
Simply select a category variable in the XLSTAT tool for creating a complete disjunctive table. The new dummy variables are created within seconds.
Here is an example of complete disjunctive table. From a data table with two category variables, with respectively two and three modalities, a complete disjunctive table is created containing five dummy variables.
Data table:
| Q1 | Q2 | |
| Obs1 | A | C |
| Obs2 | B | D |
| Obs3 | B | E |
| Obs4 | A | D |
Complete disjunctive table:
| Q1-A | Q1-B | Q2-C | Q2-D | Q2-E | |
| Obs1 | 1 | 0 | 1 | 0 | 0 |
| Obs2 | 0 | 1 | 0 | 1 | 0 |
| Obs3 | 0 | 1 | 0 | 0 | 1 |
| Obs4 | 1 | 0 | 0 | 1 | 0 |

