DataViz (Automatic Data Visualization)
Use DataViz to find the ideal graphic for your needs in just a few clicks and customize it with ease.

What is DataViz?
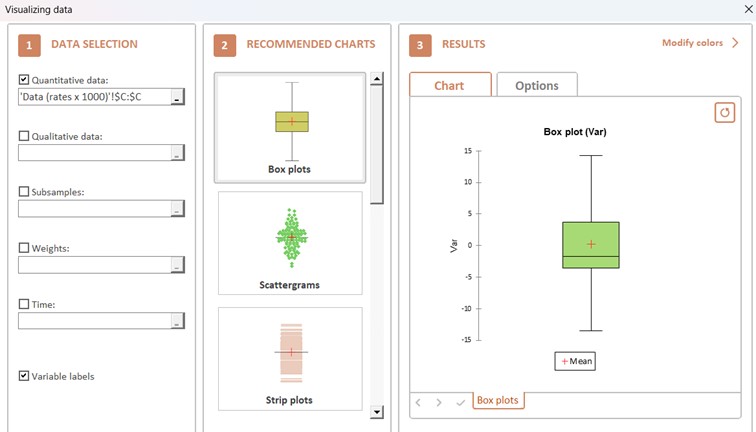
DataViz is the perfect tool for selecting a graph that matches your data without having to navigate between several features.
With DataViz, you can generate graphs in just four simple steps.
The chosen chart can be customized and exported to Excel for integration into your analyses and reports.
DataViz outputs in XLSTAT
Depending on your data (quantitative, qualitative, subsamples, weights, and time), certain graphs will be proposed:
- Boxplots
- Scatterplots
- Normal QQ plots
- Mean charts
- Histograms
- Radar charts
- Tornado diagrams
- And much more!


analyze your data with xlstat
14-day free trial