Dirichlet regression
Dirichlet regression aims to predict compositional data and can be used in many fields such as ecology, health, and economy. Available in Excel using the XLSTAT software.

What is Dirichlet regression used for?
Dirichlet regression, like Linear regression or Logistic regression, aims to make predictions based on one or several explanatory variables. However, unlike many other types of regression, a Dirichlet regression model does not predict specific values of one explained variable but several proportions of compositional data. In this sense, it is a generalization of Beta regression, the latter only enabling us to predict two proportions.
When to use Dirichlet regression?
For example, if your response variables are proportions of types of tree, Dirichlet regression can enable you to predict the proportion of oak trees, apple trees, and birch trees depending on variables such as the average air temperature, and average humidity in different geographical zones.
How does Dirichlet regression work in XLSTAT?
The Dirichlet regression function developed in XLSTAT-R calls the DirichReg function from the DirichletReg package in R (Marco Johannes Maier), which offers several options that will let you gain a deep insight into your data:
- Select several columns containing the proportions of each variable to explain
- Select several explanatory quantitative variables
- Include interactions among your data
- Choose between the common and the alternative mean/dispersion model
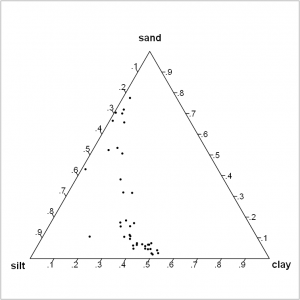
- Visualize how your data is distributed with a ternary plot
What is the difference between Dirichlet regression, Beta regression, and linear regression?
What is linear regression?
Unlike Dirichlet regression and Beta regression, linear regression does not predict proportions. It consists in predicting a quantitative variable based on one or several other quantitative variables and assumes that a linear relationship exists between the variables. Here is the equation of the linear regression model:
Y=X*β + ε
where Y is the vector of the values of the predicted variables, X the vector (or matrix) of the values of the explanatory variable(s), β the vector of regression coefficients and ε the random error. If you want to know more about linear regression in XLSTAT, do not hesitate to check out this feature.
What is Beta regression?
Beta regression is used to predict the probabilities of an event (and its opposite) occurring. It assumes that the response variable follows a Beta distribution: Y~B(μ,φ) with mu the mean and phi a precision parameter such that p=μ*φ is a shape parameter. We need to estimate these parameters with our data. To do so, we use for each variable y_t a link function such that g(μ_t)=X*β+ε and apply the linear regression method above to identify the values g(μ_t) which enable us to estimate each μ_t and φ before finding the shape parameter p.
Wondering when to use Beta regression? For example, suppose that we want to predict the probability for each French citizen to be healthy or not depending on several factors such as smoking, drinking and average hours of sleep. In this case, the event would be “healthy”, its opposite would be “unhealthy” and we would try to estimate the probability of the citizen to be healthy.
What is Dirichlet regression?
What about Dirichlet regression? Dirichlet regression is a generalization of Beta regression. Instead of predicting only one probability or proportion, it can predict several proportions or probabilities for more than two outcomes by a similar approach. We assume that the response variable follows a Dirichlet distribution, which is similar to the Beta distribution but takes into account more than one event and its opposite.
It can be used as specified above to predict proportions of different species, but it could also extend the Beta regression example to a health score on a scale of 1 to 5 instead of simply “healthy” or “unhealthy”.
Tutorial on how to run a Dirichlet regression
Here is an example of how to run a Dirichlet regression using XLSTAT-R.

