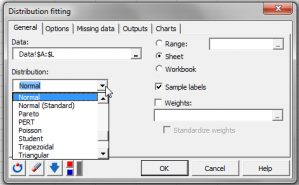
Distribution fitting
Distribution fitting checks if the distribution of a sample of data significantly differs from a theoretical distribution. Do it in Excel with XLSTAT.

What is distribution fitting
Fitting a distribution to a data sample consists, once the type of distribution has been chosen, in estimating the parameters of the distribution so that the sample is the most likely possible (as regards the maximum likelihood) or that at least certain statistics of the sample (mean, variance for example) correspond as closely as possible to those of the distribution.
Fitting methods used in XLSTAT
XLSTAT offers two fitting methods:
Moments for distribution fitting
This simple method uses the definition of the moments of the distribution as a function of the parameters to determine the latter. For most distributions, the use of the mean and the variance is sufficient. However, for certain distributions, the mean suffices (for example Poisson's distribution), or, if not, the asymmetry coefficient is also required (Weibull's distribution for example).
Maximum of Likelihood for fitting a distribution
The parameters of the distribution are estimated by maximizing the likelihood of the sample. This method, more complex, has the advantage of rigor for all distributions and enables approximate standard deviations to be obtained for parameter estimators. The maximum likelihood method is offered for the negative binomial type II distribution, Fisher-Tippett distribution, GEV distribution and Weibull distribution.
Available fitting distribution in XLSTAT
XLSTAT provides the following distributions:
Beta, Binomial, Negative binomial, Chi-square, Erlang, Exponential, Fisher, Fisher-Tippett, Gamma, GEV, Gumbel, Lognormal, Normal, Pareto, Poisson, Student, Uniform, Weibull.
Test for the goodness of fit
Once the parameters for the chosen distribution have been estimated, the hypothesis must be tested in order to check if the phenomenon observed through the sample follows the distribution in question.
XLSTAT offers two goodness of fit tests:
- The Chi-square goodness of fit test
- The Kolmogorov-Smirnov goodness of fit
Results for distribution fitting in XLSTAT
- Estimated parameters: This table displays the parameters for the distribution.
- Statistics estimated on the input data and computed using the estimated parameters of the distribution: This table is used to compare the mean, variance, skewness and kurtosis coefficients calculated from the sample with those calculated from the values of the distribution parameters.
- Kolmogorov-Smirnov test.
- Chi-square test and table of comparison between the observed and theoretical frequencies
- Histograms: The data distribution and the fitting distribution are both represented on the same histogram. This makes it a very helpful visualization tool to compare the distributions.
- Descriptive statistics for the intervals: This table shows for each interval the frequencies, the relative frequencies, together with the densities for the samples and distribution chosen.


analyze your data with xlstat
Related features