Histograms
Histograms are a very common tool to evaluate the shape of the distribution of a series of values. Available in Excel using the XLSTAT statistical software.

Histogram use
The histogram is one of the most frequently used display tools as it gives a very quick idea of the distribution of a sample of continuous or discrete data.
Histogram types
XLSTAT offers several options to create the histogram that will suit better your data:
- Intervals definition To make it easier to obtain histograms, XLSTAT lets you create histograms either by defining the number of intervals, their width or by specifying the intervals yourself. The intervals are considered as closed for the lower bound and open for the upper bound.
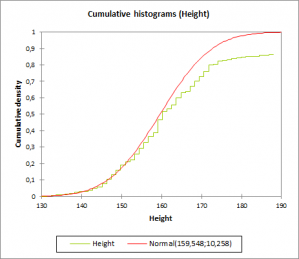
- Cumulative histogram Create cumulative histograms either by cumulating the values of the histogram or by using the empirical cumulative distribution.
- Comparison to a theoretical distribution XLSTAT lets you compare the histogram with a theoretical distribution whose parameters have been set by you. However, if you want to check if a sample follows a given distribution, you can use the distribution fitting tool to estimate the parameters of the distribution and if necessary check if the hypothesis is acceptable.
Distribution to be added to a histogram
XLSTAT provides the following distributions:
- Arcsine
- Bernoulli
- Beta (2 options)
- Binomial
- Negative binomial type I and II
- Chi-square
- Erlang
- Exponential
- Fisher
- Fisher-Tippett
- Gamma
- GEV (Generalized Extreme Values)
- Gumbel
- Logistic
- Lognormal
- Normal
- Standard normal
- Pareto
- PERT
- Poisson
- Student
- Trapezoidal
- Uniform and Uniform discrete
- Weibull (3 options)


analyze your data with xlstat
14-day free trial
Related features