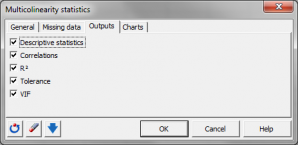
Multicollinearity statistics
Multicollinearity statistics measure the strength of linear relationships among variables in a set. Available in Excel using the XLSTAT statistical software.

What is multicollinearity
Variables are said to be multicollinear if there is a linear relationship between them. This is an extension of the simple case of collinearity between two variables. For example, for three variables X1, X2 and X3, we say that they are multicollinear if we can write:
X1 = aX2 + bX3
where a and b are real numbers.
How to detect multicollinearity
To detect the multicolinearities and identify the variables involved, linear regressions must be carried out on each of the variables as a function of the others. We then calculate:
- The R² of each of the models If the R² is 1, then there is a linear relationship between the dependent variable of the model (the Y) and the explanatory variables (the Xs).
- The tolerance for each of the models. The tolerance is (1-R²). It is used in several methods (linear regression, logistic regression, discriminant factorial analysis) as a criterion for filtering variables. If a variable has a tolerance less than a fixed threshold (the tolerance is calculated by taking into account variables already used in the model), it is not allowed to enter the model as its contribution is negligible and it risks causing numerical problems.
- The VIF (Variance Inflation Factor) The VIF is equal to the inverse of the tolerance.
Use of multicollinearity statistics
Detecting multicollinearities within a group of variables can be useful especially in the following cases:
- To identify structures within the data and take operational decisions (for example, stop the measurement of a variable on a production line as it is strongly linked to others which are already being measured),
- To avoid numerical problems during certain calculations. Certain methods use matrix inversions.
- When multiple linear regression is run on multicollinear independent variables, coefficient estimation could be wrong. The XLSTAT linear regression feature allows to automatically calculate multicollinearity statistics on the independent variables. Thus, the user can choose to remove independent variables that are too redundant with the others. Notice that the PLS regression is not sensitive to multicollinearity. However, this method is mostly used for predictive purposes and not to focus on coefficient estimations.


analyze your data with xlstat
Related features