Proportional Hazards Model with interval censored data
Use the interval-censored proportional hazard model to model survival time based on quantitative or qualitative explanatory variables. Available in Excel with the XLSTAT sofware.

What is Proportional Hazards Model with interval censored data?
The principle of the proportional hazards model is to link the survival time of an individual to covariates. For example, in the medical domain, we are seeking to find out which covariate has the most important impact on the survival time of a patient.
The first proportional hazard model, introduced by Cox in 1972, works with uncensored data and right censored data. The purpose of the proportional hazard model with interval censored data is, therefore, the same as for the Cox model, but it will also be possible to model survival times for interval-censored data, uncensored data, left censored data or right censored data.
If the data contains only uncensored or right-censored observations, it is possible, with this function, to reproduce the results of a Cox model. However, it is recommended to use Cox's proportional hazards model as it provides a more suitable method for this type of case. Both quantitative and qualitativeexplanatory variables can be taken into account.
Options for Proportional Hazards Model with interval censored data in XLSTAT
Optimize the number of knots: this option allows to optimize the number of knots used for spline calculation. The "best" number of knots will then be the one that optimizes the AIC of the model. In case this option is not activated, the number of nodes will be 3.
Interactions / Level: Interactions can be included in the model.
Results for Proportional Hazards Model with interval censored data in XLSTAT
XLSTAT displays a large number of tables and charts to help in analyzing and interpreting the results.
Summary statistics: This table displays descriptive statistics for all the variables selected. For the quantitative variables, the number of missing values, the number of non-missing values, the mean and the standard deviation (unbiased) are displayed. For qualitative variables, the categories with their respective frequencies and percentages are displayed.
Goodness of fit coefficients: This table displays a series of statistics for the independent model (corresponding to the case where there is no impact of covariates, beta=0) and for the adjusted model.
- Observations: The total number of observations taken into
- DF: Degrees of freedom
- 2 Log(Like.): The logarithm of the likelihood function associated with the model
- AIC: Akaike’s Information Criterion;
- SBC: Schwarz’s Bayesian Criterion;
- Iterations: Number of iterations until convergence.
Model parameters: The parameter estimate, corresponding standard deviation, Wald's Chi2, the corresponding p-value and the confidence interval are displayed for each variable of the model. The hazard ratios for each variable with confidence intervals are also displayed.
Predictions are given for each observation.
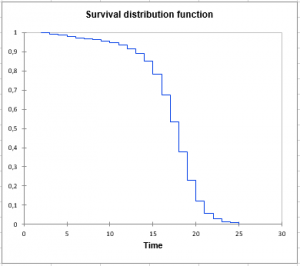
Charts: Depending on the selected options, charts are displayed: Cumulative Survival distribution function (SDF), -Log(SDF) and Log(-Log(SDF)).


analyze your data with xlstat
Related features