One-sample t-test and z-test
Use the one-sample t-test or z-test to compare the average of a sample to a reference. Do it in Excel using the XLSTAT add-on statistical software.

What are one-sample t and z tests
This tool is used to compare the average of a sample represented by µ with a reference value.
Let the average of a sample be represented by μ. To compare this mean with a reference value μ0 , two parametric tests are possible:
Student's t test
The z test
One-sample t-test uses a t-distribution with n-1 degrees of freedom.
When to use the Student's t-test or the z-test
Two parametric tests are possible but they should be used on certain conditions:
The Student's t-test
Use the Student's t-test when the true variance of the population from which the sample has been extracted is unknown; the variance of sample s² is used as variance estimator.
The z-test
Use the z-test when the true variance σ² of the population is known.
These two tests are said to be parametric as their use requires the assumption that the samples are distributed normally. Moreover, it also assumed that the observations are independent and identically distributed. The normality of the distribution can be tested beforehand using the normality tests.
Nonparametric equivalents are proposed by XLSTAT. Check out this guide to know more on the assumptions of parametric tests and choose the right test according to your question, the type of your variables (i.e., categorical variables, binary, continuous) and the distribution of data.
Two-tailed or one-tailed test
A statistical test is based on two competing hypotheses: the null hypothesis H0 and the alternative hypothesis Ha. The type of alternative hypothesis Ha defines if a test is one-tailed or two-tailed.
Two-tailed tests
A Two-tailed test is associated to an alternative hypotheses for which the sign of the potential difference is unknown. For example, suppose we wish to compare the averages of two samples A and B. Before setting up the experiment and running the test, we expect that if a difference between the two averages is highlighted, we do not really know whether A would be higher than B or the opposite. This drives us to choose a two-tailed test, associated to the following alternative hypothesis: Ha: average(A) ≠ average(B). Two-tailed tests are by far the most commonly used tests.
One-tailed tests
A One-tailed test is associated to an alternative hypothesis for which the sign of the potential difference is known before running the experiment and the test. In the example described above, the alternative hypothesis related to a one-tailed test could be written as follows: average(A) < average(B) or average(A) > average(B), depending on the expected direction of the difference.
Three types of one-sample test are possible in XLSTAT depending on the alternative hypothesis chosen:
- For the two-tailed test, the null H0 and alternative Ha hypotheses are as follows: H0 : µ = µ0 Ha : µ ≠ µ0
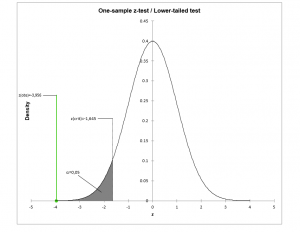
- In the left one-tailed test, the following hypotheses are used: H0 : µ = µ0 Ha : µ < µ0
- In the right one-tailed test, the following hypotheses are used: H0 : µ = µ0 Ha : µ > µ0
Options for one-sample t and z tests in XLSTAT
Data format
One column/row per sample: Activate this option for XLSTAT to consider that each column (column mode) or row (row mode) corresponds to a sample. You can then test the hypothesis on several samples at the same time.
One sample: Activate this for XLSTAT to consider that all the selected values, whatever the number of rows or columns belong to the same sample.
Significance level
The default value is set at 5% in the diaog box but we can enter the significance level of our choice.
When setting up a study, a risk threshold above which the null hypothesis (H0) should not be rejected must be specified. This threshold is referred to as the significance level alpha and should lay between 0 and 1. Low alpha’s are more conservative. The choice of alpha should depend on how dangerous it is to reject H0 while it is true. For example, in a study aiming at demonstrating the benefits of a medical treatment, alpha should be low. On the other hand, when screening the effects of many attributes on the appreciation of a product, alpha’s could be more moderate. Very often, alpha is set at 0.05 or 0.01 or 0.001.
Population variance for z test
Where a z test has been requested, the population variance value must be entered.
Variance for the z test:
Estimated using samples: Activate this option for XLSTAT to estimate the variance of the population from the sample data. This should, in principle, lead to a t test, but this option is offered for teaching purposes only.
User defined: enter the value of the known variance of the population.
Tutorial on one-sample t and z tests in XLSTAT
This tutorial shows how to test the difference between an observed mean and a theoretical one, using the one sample t-test and z-tests feature in XLSTAT.


analyze your data with xlstat
Related features