Comparación de métodos (Bland Altman, ...)
Method comparison allows to compare a method to a reference or to another method. Many options are available in Excel using the XLSTAT statistical software.

When to use method comparison
When developing a new method you might want to be sure that the results are similar to a reference or a comparable method. If there is a difference, you should investigate the reasons. It may be due to a bias that depends on the position on the scale variation. In addition If a new measurement method is preferred for economic reasons, but do not performed as good as the reference method, you might take into account the bias while reporting the results.
XLSTAT tools to compare methods
XLSTAT provides a series of tools to evaluate the performance of a method compared to another.
Paired t-test for method comparison
Among the comparison methods, a paired t-test can be computed. The paired t-test allows to test the null hypothesis H0 that the mean of the differences between the results of the two methods is not different from 0, against an alternative hypothesis Ha that it is.
Scatter plots for comparing methods
First, you can draw a scatter plot to compare the reference or comparative method against the method being tested. If the data are on both sides of the identity line (bisector) and close to it, the two methods give close and consistent results. If the data are above the identify line, the new method overestimates the value of interest. If the data are under the line, the new method underestimates the value of interest, at least compared to the comparative or reference method. If the data are crossing the identify line, there is a bias that depends on where you are on the scale of variation. If the data are randomly scattered around the identity line with some observations that are far from it, the new method is not performing well.
Bias for method comparison
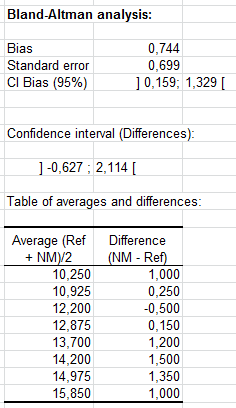
The bias is estimated as the mean of the differences between the two methods. If replicates are available, a first step computes the mean of the replicates. The standard deviation is computed as well as a confidence interval. Ideally, the confidence interval should contain 0.
Note: The bias is computed for the criterion that has been chosen for the Bland Altman analysis (difference, difference % or ratio).
Bland Altman and related comparison methods
Bland and Altman recommend plotting the difference (T-S) between the test (T) and comparative or reference method (S) against the average (T+S)/2 of the results obtained from the two methods. In the ideal case, there should not be any correlation between the difference and the average whether there is a bias or not. XLSTAT tests whether the correlation is significantly different from 0 or not. Alternative possibilities are available for the ordinates of the plot: you can choose between the difference (T-S), the difference as a % of the sum (T-S)/(T+S), and the ratio (T/S). On the Bland Altman plot, XLSTAT displays the bias line, the confidence lines around the bias, and the confidence lines around the difference (or the difference % or the ratio).
Histogram and box plot for method comparison
Histogram and box plots of the differences are plotted to validate the hypothesis that both are normally distributed, which is used to compute confidence intervals around the bias and the individual differences. When the size of the samples is small the histogram is of little interest and one should only consider the box plot. If the distribution does not seem to be normal, one might want to verify that point with a normality test, and one should consider with caution the confidence intervals.
Difference plot for comparing methods
The difference plot shows the difference between the two methods against the average of both methods, or against the reference method with an estimate of the bias, using the criterion that has been chosen (difference, difference in %, or ratio), the standard error and a confidence interval being as well displayed.


analice sus datos con xlstat
Incluido en
Productos relacionados