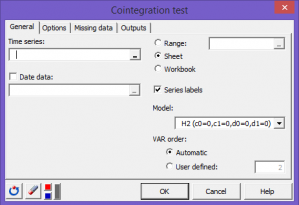
Prueba de cointegración
Cointegration tests investigate possible correlations among several time series on the long term. Run cointegration tests in Excel using the XLSTAT software.

Use this module to perform VAR-based cointegration tests on a group of two or more I(1) time series using the approach proposed by Johansen (1991, 1995).
What are cointegration tests?
Economic theory often suggests long-term relationship between two or more economic variables. Although those variables can derive from each other on a short term basis, the economic forces at work should restore the original equilibrium between them on the long run. We say that those variables are cointegrated. Examples of such relationships in economics include money with income, prices and interest rates or exchange rate with foreign and domestic prices. In finance, such relationships are expected for instance between the prices of the same asset on different market places.
The term of cointegration was first introduced by Engle and Granger (1987) after the work of Granger and Newbold (1974) on spurious regression. It identifies a situation where two or more non stationary time series are bound together in such a way that they cannot deviate from some equilibrium in the long term. In other words, there exists one or more linear combination of those I(1) time series (or integrated of order 1, see unit root test) that is stationary (or I(0)). Those stationary combinations are called cointegrating equations.
One of the most interesting approaches for testing for cointegration within a group of time series is the maximum likelihood methodology proposed by Johansen (1988, 1991). This approach, implemented in XLSTAT, is based on Vector Autoregressive (VAR) models. It is not limited to two time series and allows you to test the existence of multiple cointegrating relationships.
Cointegration tests results in XLSTAT
VAR order estimation: If the automatic option is selected for the VAR order, this table displays the four criteria values for the VAR order estimation. Each line corresponds to the evaluation of one number of lags from 1 up to the maximum number of lag. The discriminating criterion is in bold.
Lambda max test: This table displays for each rank of cointegration tested the corresponding eigenvalue, the lambda max test statistic and the associated critical value and p-values (MacKinnon et al. 1998).
Trace test: This table displays for each rank of cointegration tested the corresponding eigenvalue, the trace test statistic and the associated critical value and p-values (MacKinnon et al. 1998).
Adjustment coefficients (alpha): This table displays the resulting loading matrix α (see XLSTAT's help document for more details).
Cointegration coefficients (beta): This table displays the cointegrating matrix β (see XLSTAT's help document for more details).
References
Granger C. and Newbold P. (1974). Spurious regressions in econometrics. Journal of econometrics, 2(2), pp.111-120.
Johansen, S. (1988). Statistical analysis of cointegration vectors. Journal of economic dynamics and control, 12(2), pp.231-254.
Johansen S. (1991). Estimation and Hypothesis Testing of Cointegration Vectors in Gaussian Vector Autoregressive Models. Econometrica: Journal of the Econometric Society, pp.1551-1580.
Johansen S. (1995). Likelihood based inference in cointegrated vector autoregressive models. OUP catalogue.
MacKinnon, J. G., Haug, A. A., & Michelis, L. (1998). Numerical distribution functions of likelihood ratio tests for cointegration (No. 9803). Department of Economics, University of Canterbury.


analice sus datos con xlstat
Incluido en
Productos relacionados