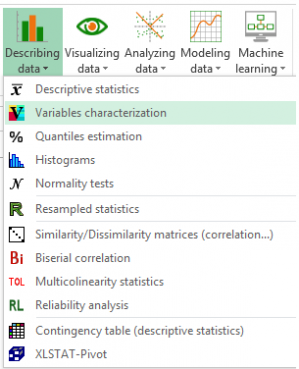
Variable characterization
Variable characterization will let you easily describe quantitative or qualitative variables. It is available in Excel using the XLSTAT statistical software.

What is variable characterization?
Use this tool to characterize elements (quantitative variables, qualitative variables or categories of qualitative variables) exploring the links they share with characterizing elements (quantitative variables, qualitative variables or categories of qualitative variables). For this purpose, different statistical tests (parametric or non-parametric) are used.
Here are the various characterizing possibilities of the procedure:
1) Characterization of a quantitative variable:
i) With other quantitative variables:
Characterization of a quantitative variable by other quantitative variables is carried out using the correlation coefficient. For each characterizing quantitative variable, it is tested whether the correlation coefficient is significantly different from 0. The Pearson correlation coefficient is used in the case of a parametric test and the Spearman correlation coefficient is used in the non-parametric case. The more significantly the correlation coefficient differs from 0, the more the two quantitative variables are linked.
ii) With qualitative variables:
Characterization of a quantitative variable by qualitative variables is performed using parametric or non-parametric statistical tests. If the p-value of the test is lower than a selected threshold the assumption of independence between the two variables is rejected. In the parametric case, the Fisher test is used (as in ANOVA). In the non-parametric case, if the qualitative variable has k=2k=2 categories then the Mann-Whitney test is used. For more than 2 categories, the Kruskal-Wallis test is used.
iii) With categories of a qualitative variable:
Characterization of a quantitative variable by categories is carried out using a mean comparison test. For each category, it consists in determining whether the mean of the quantitative variable to characterize in the group whose members share this category is significantly different from the mean of the quantitative variable to characterize considering the whole sample. This characterization is carried out using an indicator called test value (Lebart, 2000). A p-value associated with this test value is then calculated, the closer the p-value is to 0, the more the average of the variable XX on the category kk is different from the general average.
2) Characterization of a qualitative variable (with k categories):
i) With quantitative variables:
Characterization of a qualitative variable by quantitative variables is performed using parametric or non-parametric statistical tests. If the p-value of the test is lower than a selected threshold the assumption of independence between the two variables is rejected. In the parametric case, the Fisher test is used (as in ANOVA). In the non-parametric case if the qualitative variable has k=2k=2 categories, the Mann-Whitney test is used, if the qualitative variable has more than 2 categories, the Kruskal-Wallis test is used.
ii) With other qualitative variables:
Characterization of a qualitative variable by other qualitative variables is carried out using an independence test. For each characterizing qualitative variable, we test the independence with the qualitative variable to characterize with the Chi² independence test (parametric) or the exact Fisher test (nonparametric).
3) Characterization of a category:
i) With quantitative variables:
Characterization of a category of a qualitative variable by quantitative variables is done using the test value as explained in 1-iii.
ii) With other categories:
Characterization of a category with other categories is done using the test value for qualitative variables (Lebart, 2000) and its associated p-value. A category is considered to be characterizing a class if its abundance in the class is considered significantly superior to what can be expected given its presence in the whole population.
Variable characterization options in XLSTAT
Filter characterizing elements: Several options are available to filter the characterizing elements to display. Depending on the chosen option, you must choose a threshold for the p-values (or test values) to display or a number p of characterizing elements to display.
Sort characterizing elements: Activate this option if you want to sort the display of the characterizing elements according to the p-values.
Significance level: Enter the significance level you want in the associated cell.
Parametric tests: Active this option if you want to perform a parametric test.
Non-parametric tests: Active this option if you want to perform a non-parametric test.
Variable characterization output in XLSTAT
Summary statistics: This table displays descriptive statistics for all the variables selected.
The results of the main output table differ depending on the type of variables used as elements to be characterized as well as characterizing elements. In all cases, p-values are always displayed.
If you have selected the p-value chart option, a bar chart with p-values is also displayed below each table.


analice sus datos con xlstat
Productos relacionados