Versuchsplan für sensorische Diskriminierungstests
Designing properly your sensory discrimination test is an important step in the procedure. Do it directly in Excel using the XLSTAT statistical software.

Designing sensory discrimination tests in Excel with XLSTAT
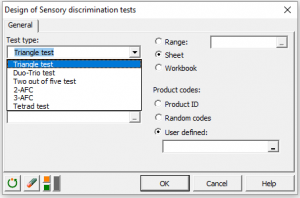
This tool allows you to create an experimental design in the context of sensory discrimination tests. It will allow you to generate the setting of a sensory discrimination test including triangle test, duo-trio test…
Designing an experiment is a fundamental step for anyone who wants to ensure that data collected will be statistically usable in the best possible way. No use to evaluate products from a panel of assessors if the products cannot be compared under statistically reliable conditions. It is also not necessary to have each assessor evaluate all products to compare products between them.
This tool is designed to provide specialists in sensory analysis to provide a simple and powerful tool to prepare a sensory discrimination test where assessors (experts and/or consumers) evaluate a set of samples.
When new products are setup in sensory analysis, discrimination tests are very important. XLSTAT allows you to generate combination of products to be presented to your assessors so that they are in the correct settings for that kind of test.
Sensory discrimination test are based on comparing two products that are presented in a specific setting.
When creating your design, you have to know which test you want to apply, the number of assessors and, if possible, the number of assessors.
XLSTAT allows you to run:
- Triangle test: 3 samples are presented to each assessor in different orders. Within these samples, two are similar and the third one is different. Assessors have to identify the sample that is different from the others.
- Duo-trio test: Assessors taste a reference product. Then they taste two different products. Assessors must identify the product that is similar to the reference product.
- Two out of five test: five samples are presented to the assessors. These samples are separated in two groups, the first one having three similar samples and the second one having two similar samples. The assessors have to identify the group of two similar samples.
- 2-AFC test: 2 products are presented to each assessor. The assessor has to tell which product has the highest intensity on a particular characteristic.
- 3-AFC test: 3 samples are presented to each assessor. Two are similar and the third one is different. The assessor has to tell which sample has the highest intensity on a particular characteristic.
- Tetrad test: Four samples similar two by two are presented to each assessor. Each assessor has two identify both groups of samples.
You can specify more than one session and add labels to the assessors and products.


analysieren sie ihre daten mit xlstat
Enthalten ind
Verwandte Funktionen