Correlation tests
Correlation tests are used to test the association between two quantitative variables. Available in Excel using the XLSTAT add-on statistical software.

Correlation tests in XLSTAT
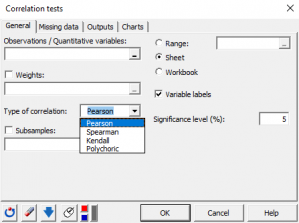
This tool to compute different kinds of correlation coefficients, between two or more variables, and to determine if the correlations are significant or not.
Options for correlation tests in XLSTAT
XLSTAT proposes three correlation coefficients to compute the correlation between a set of quantitative variables, whether continuous, discrete or ordinal:
Pearson correlation coefficient
The Pearson coefficient corresponds to the classical linear correlation coefficient. This coefficient is well suited for continuous data. Its value ranges from -1 to 1, and it measures the degree of linear correlation between two variables.
Note: the squared Pearson correlation coefficient gives an idea of how much of the variability of a variable is explained by the other variable. The p-values that are computed for each coefficient allow testing the null hypothesis that the coefficients are not significantly different from 0. However, one needs to be cautious when interpreting these results, as if two variables are independent, their correlation coefficient is zero, but the reciprocal is not true.
Spearman correlation coefficient (rho)
The Spearman coefficient is based on the ranks of the observations and not on their value. It can be thus be considered as non parametric. This coefficient is adapted to ordinal data. One can interpret this coefficient in terms of explained variability of the ranks.
Kendall correlation coefficient (tau)
It is well suited for ordinal variables as it is based on ranks. It can be thus be considered as non parametric. It can be interpreted in terms of probability - it is the difference between the probabilities that the variables vary in the same direction and the probabilities that the variables vary in the opposite direction. When the number of observations is lower than 50 and when there are no ties, XLSTAT gives the exact p-value. If not, an approximation is used. The latter is known as being reliable when there are more than eight observations.
Polychoric correlation coefficient
The polychoric correlation coefficient characterizes the relation between two ordinal variables. It is frequently used to analyze survey data with ordinal responses. Under the assumption that the ordinal variables are derived from the discretization of two unobserved quantitative random variables with a normal distribution, the polychoric correlation coefficient aims to measure the relation between those two unobserved quantitative variables.
XLSTAT also provides options such as filtering (using R2) and sorting (BEA or FPC method) the variables.
Outputs of correlation tests in XLSTAT
- Descriptive statistics
- Correlations
- p-values
- Coefficients of determination (R2)
- Correlation maps

