Tests on contingency tables
Chi-square and Fisher exact tests on contingency tables test the association between two qualitative variables. Run them in Excel using the XLSTAT software.

What are tests on contingency tables?
Tests on contingency tables are used to evaluate the association and the independence between the rows and the columns of a contingency table as well as to calculate various association measures.
Tests of independence between the rows and the columns of a contingency table in XLSTAT
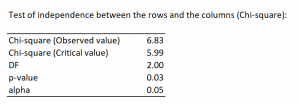
- The Pearson chi-square statistic allows to test the independence between the rows and the columns of the table, by measuring to which extent the observed table is far (in the chi-square sense) from the expected table computed using the same marginal sums.
One shows that this statistic follows a Chi-square distribution with (R-1)(C-1) degrees of freedom. However, this result is asymptotical and, before using the test, it is recommended to make sure that:
That n is greater or equal to 20;
That no marginal sum is less than 5;
That at least 80% of the expected values is above 5;
In the case where R = 2 and C = 2 , a continuity correction has been suggested by Yates (1934).
A test based on the likelihood ratio and on the Wilks’ G2 statistic has been developed as an alternative to the Pearson chi-square test. It consists in comparing the likelihood of the observed table to the likelihood of the expected table defined as for the Pearson chi-square test
The Fisher’s exact test allows to compute the probability that a table showing a stronger association between the rows and the columns would be observed, the marginal sums being fixed, and under the null hypothesis of independence between rows and columns. In the case of a 2 x2 table, the independence is measured through the odds ratio.
Monte Carlo test: A nonparametric test based on simulations has been developed to test the independence between rows and columns. A number of Monte Carlo simulations defined by the user are performed in order to generate contingency tables that have the same marginal sums as the observed table. The chi-square statistic is computed for each of the simulated tables. The p-value is then determined by suing the distribution obtained from the simulations.
Association coefficients between the rows and the columns of a contingency table in XLSTAT
A first series of association coefficients between the rows and the columns of a contingency table is proposed:
- the Phi coefficient,
- the Contingency coefficient,
- Cramer's V,
- Tschuprow's T,
- Goodman and Kruskal tau (R/C) and (C/R),
- Cohen’s kappa,
- Yule’s Q,
- Yule’s Y.
Association coefficients between the rows and the columns of a contingency table with confidence ranges in XLSTAT
A second series of association coefficients between the rows and the columns of a contingency table is proposed. Confidence ranges around the estimated values are available. As the confidence ranges are computed using asymptotical results, their reliability increased with the number of the data.
- Goodman and Kruskal Gamma,
- Kendall’s tau,
- Stuart’s tau,
- Somers’ D (R/C) and (C/R),
- Theil’s U (R/C) and (C/R),
- Odds ratio and Log(Odds ratio).
XLSTAT charts for contingency tables
3D view of the contingency table: Activate this option to display the 3D bar chart corresponding to the contingency table.
2D Bar Charts:
Chart type
- Grouped: Choose this option to display the graphs as bars grouped by modality.
- Stacked bars: Choose this option to display the chart as stacked bars. These charts are used to compare the frequencies of sub-samples to those of a full sample.
Bar charts
- Frequencies: Choose this option to display the frequencies corresponding to each bar.
- Percentages: Choose this option to display the % of population corresponding to each bar.
Tutorial on how to set up and interpret Chi-square and Fisher’s exact tests
A tutorial on Chi-square and Fisher’s exact tests is available on evaluating the association between two qualitative variables measured on a banana sample: variety and presence/absence of maggots.

