Generalized Bradley-Terry model
Use this tool to fit a Bradley-Terry model to data obtained from pairwise comparisons. Available in Excel using the XLSTAT software.

Description of the generalized Bradley-Terry model
The generalized Bradley-Terry model is used to describe possible outcomes when elements of a set are repeatedly compared with one another in pairs.
For example, in a marketing study, k products are evaluated by consumers. The products are submitted in pairs and the consumers are asked to indicate which product they prefer or if they cannot decide.
Options of the generalized Bradley-Terry Model in XLSTAT
It is possible to choose different inference methods:
Numerical: The model is rewritten as a logistic regression. Ties are not allowed.
Bayesian EM: The parameters are supposed to be distributed as a Gamma distribution. The inference is done via an EM algorithm which aims at updating the prior distributions. The parameters of the complete model (with home-field advantage and ties) cannot be inferred with this algorithm.
Sampling: The parameters are supposed to be distributed as a Gamma distribution. The posterior distribution is obtained by a Gibbs sampler.
Two other model options can also be selected:
Home: Select this option to take home-field advantage into account. In this case, the order of the elements in the pairs table is of importance. The first element is supposed to be at home.
Ties: Select this option if ties are allowed. If the option is enabled, the variables table must have 3 columns.
Results of the generalized Bradley-Terry model in XLSTAT
Summary statistics: This table displays the descriptive statistics for each element
Estimated parameters: the estimates of the model parameters are given in this table. The standard error and the confidence interval are also provided for each parameter.
Likelihood-based criterion: In this table, several likelihood-based criteria are given (-2*log(Likelihood), BIC, AIC).
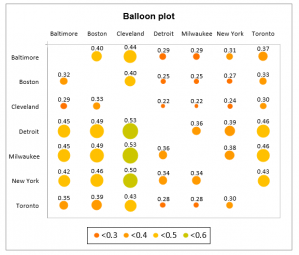
Probabilities of winning: This table provides the probability that element ii (in row) beats element jj (in column), given the model parameters.
Convergence graph: This chart displays for each parameter the evolution of the parameter and the corresponding confidence interval.


analyze your data with xlstat
Included in
Related features