Plot management
Useful tools to edit your plots in Excel using the XLSTAT software: change point size, labels and colors, plot resizing and transformation...

XLSTAT provides you with tools to help you with customizing your plots.
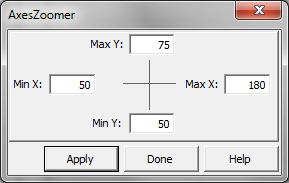
AxesZoomer
A great tool for zooming in and out on Excel charts. It's simple and fast.
Easy label
A very simple thing that Excel can't do: plots with labels corresponding to data stored in a third column just on the left of the X values. The format of the labels on the Excel sheet (color, size, ...) can optionally be copied to the chart.
Reposition labels
To change the position of observation labels on a chart.
EasyPoints
To modify the size, the color or the shape of the points that are displayed in an Excel chart.
Orthonormal plot
An orthonormal plot is where a unit on the X-axis appears the same size as a unit on the Y-axis. Orthonormal plots avoid interpretation errors due to the effects of dilation or overwriting. This tool adjusts the minimum and maximum of the X- and Y- axes so that the plot becomes orthonormal. This tool is particularly useful if you have enlarged an orthonormal plot produced by XLSTAT (for example after a PCA) and you want to ensure the plot is still orthonormal.
Resize chart
To resize a chart, or a plot area inside a chart.
Plot transformation
This tool allows you to select a plot (chartsheet or chart objet on a sheet) and by indicating the transformations you require, obtain a new plot integrating the three optional transformations requested: symmetry, translation, rotation.
Merge charts
Use this tool to merge multiple plots into one.


analice sus datos con xlstat
Productos relacionados