Pivot table
Design pivot tables with respect to a target variable in Excel using the Pivot table tool of the XLSTAT add-on statistical software.

What is a Pivot table?
A pivot table (or contingency table, or two-way table) is a synthetic representation of occurrences observed on an N-size population for crosses of all the different categories of two variables.
A dynamic pivot table allows to take more than two variables into account and to organize the table structure into a hierarchy. The table is said to be dynamic in the sense that software functionalities allow to navigate among the hierarchy and to create a focused view on particular classes of particular variables.
Dynamic pivot table in XLSTAT software
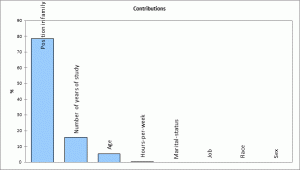
XLSTAT allows you to create dynamic pivot tables whose structure is optimized with respect to a target variable. The target variable can be a qualitative variable (with a target category), or a quantitative variable. Numeric continuous or discrete explanatory variables are automatically sliced into classes that contribute to optimize the quality of the table.
By inputing a table that contains a set of observations described by categorical and numerical variables - including the target variable which corresponds to the phenomenon of interest (revenue, response or not to a direct mailing, among others) - into XLSTAT you will be able to:
- Create a dynamic pivot table with a hierarchy among the variables depending on their contributions to the target variable,
- Identify the variables holding the most influence over the target variable,
- Identify the combination of variables modt influencing the target variable,
- Build optimal classes for the numerical variables, making it possible to use them in the dynamic pivot table.


analyze your data with xlstat
Related features