Principal Component Regression (PCR)
Principal Component Regression (PCR) combines PCA and OLS. It has advantages compared to classic regression. Available in Excel with the XLSTAT software.

What is Principal Component Regression
PCR (Principal Components Regression) is a regression method that can be divided into three steps:
- The first step is to run a PCA (Principal Components Analysis) on the table of the explanatory variables,
- Then run an Ordinary Least Squares regression (OLS regression) also called linear regression on the selected components,
- Finally compute the parameters of the model that correspond to the input variables.
Principal Component Regression models
PCA allows to transform an X table with n observations described by variables into an S table with n scores described by q components, where q is lower or equal to p and such that (S’S) is invertible. An additional selection can be applied on the components so that only the r components that are the most correlated with the Y variable are kept for the OLS regression step. We then obtain the R table.
The OLS regression is performed on the Y and R tables. In order to circumvent the interpretation problem with the parameters obtained from the regression, XLSTAT transforms the results back into the initial space to obtain the parameters and the confidence intervals that correspond to the input variables.
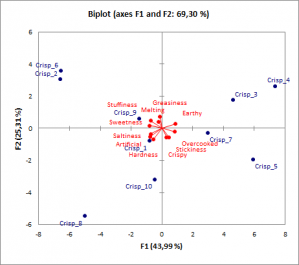
PCR graphical output: Correlation and observations charts and biplots
As PCR is build on PCA, a great advantage of PCR regression over classical regression is the available charts that describe the data structure. Thanks to the correlation and loading plots it is easy to study the relationship among the variables. It can be relationships among the explanatory variables, as well as between explanatory and dependent variables. The score plot gives information about sample proximity and dataset structure. The biplot gather all these information in one chart.
Prediction with Principal Component Regression
Principal Componenet Regression is also used to build predictive models. XLSTAT enable you to predict new samples' values.
In the predictions and residuals table, the weight, the value of the explanatory variable if there is only one, the observed value of the dependent variable, the corresponding prediction, the residuals and the confidence intervals and the adjusted prediction are displayed for each observation. Two types of confidence intervals are displayed: an interval around the mean and an interval around an individual prediction.
PCR options in XLSTAT
Standardized PCA: Activate this option to run a PCA on the correlation matrix. Inactivate this option to run a PCA on the covariance matrix (unstandardized PCA).
Filter components: You can activate one of the two following options in order to reduce the number of components used in the model:
Minimum %: Activate this option and enter the minimum percentage of total variability that the selected components should represent.
Maximum number: Activate this option to set the maximum number of components to take into account.
Sort components by: Choose one of the following options to determine "which criterion should be used to select the components on the basis of the "Minimum %", or of the "Maximum number":
Correlations with Ys: Activate this option so that the components selection is based on the sorting down of R² coefficient between the dependent variable $Y$ and the components. This option is recommended.
Eigenvalues: Activate this option so that the selection of the components is based on the sorting down of the eigenvalues corresponding to the components.


analice sus datos con xlstat
Productos relacionados