CONTOUR PLOT AND SURFACE PLOT
This type of visualization enables you to explore the relationship between a response variable and two predictor variables. They are available in Excel using the XLSTAT statistical software.

WHAT ARE CONTOUR PLOT AND SURFACE PLOT?
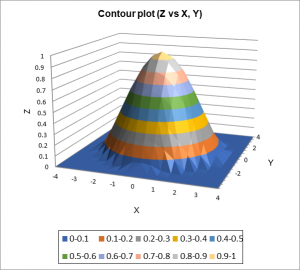
Contour plot and surface plot represent a three-dimensional surface by drawing contours on a two-dimensional plane. The X and Y values are plotted along the respective axes, while the contour lines and bands depict the Z value. The difference between the two types of plots is the infill between the contour lines – this is only present in the surface plot.
This type of chart finds extensive application in cartography, where contour lines signify consistent elevations, but is also used in a lot of other domains as sensory analysis.
WHAT ARE CONTOUR PLOT AND SURFACE PLOT IN XLSTAT
XLSTAT allows you to display charts in different formats:
- Contour plot
- Surface plot
- Surface plot with grid
All these plots can be seen in a 2D or 3D view.
XLSTAT also allows you to perform data interpolation when the data is not balanced:
- Bilinear interpolation
- Bicubic interpolation

