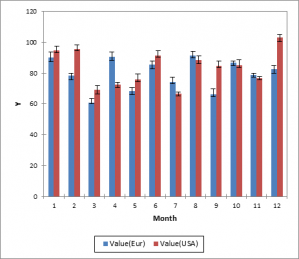
Error bars
An quick, easy and efficient way to add error bars on your Excel chart using the XLSTAT add-on statistical software.

Plot with error bars
It is often useful to report values with their errors in order to visualize the trends taking into account possible variations.
Plotting error bars with XLSTAT
This tool is there to get around a failure of Microsoft Excel: if it is possible to add error bars on different types of graphs, this operation is tedious if the bounds are not the same for all points. With this tool you can create a chart with error bars at once and the errors do not have to be constant.


analyze your data with xlstat
14-day free trial